Admin Dashboard
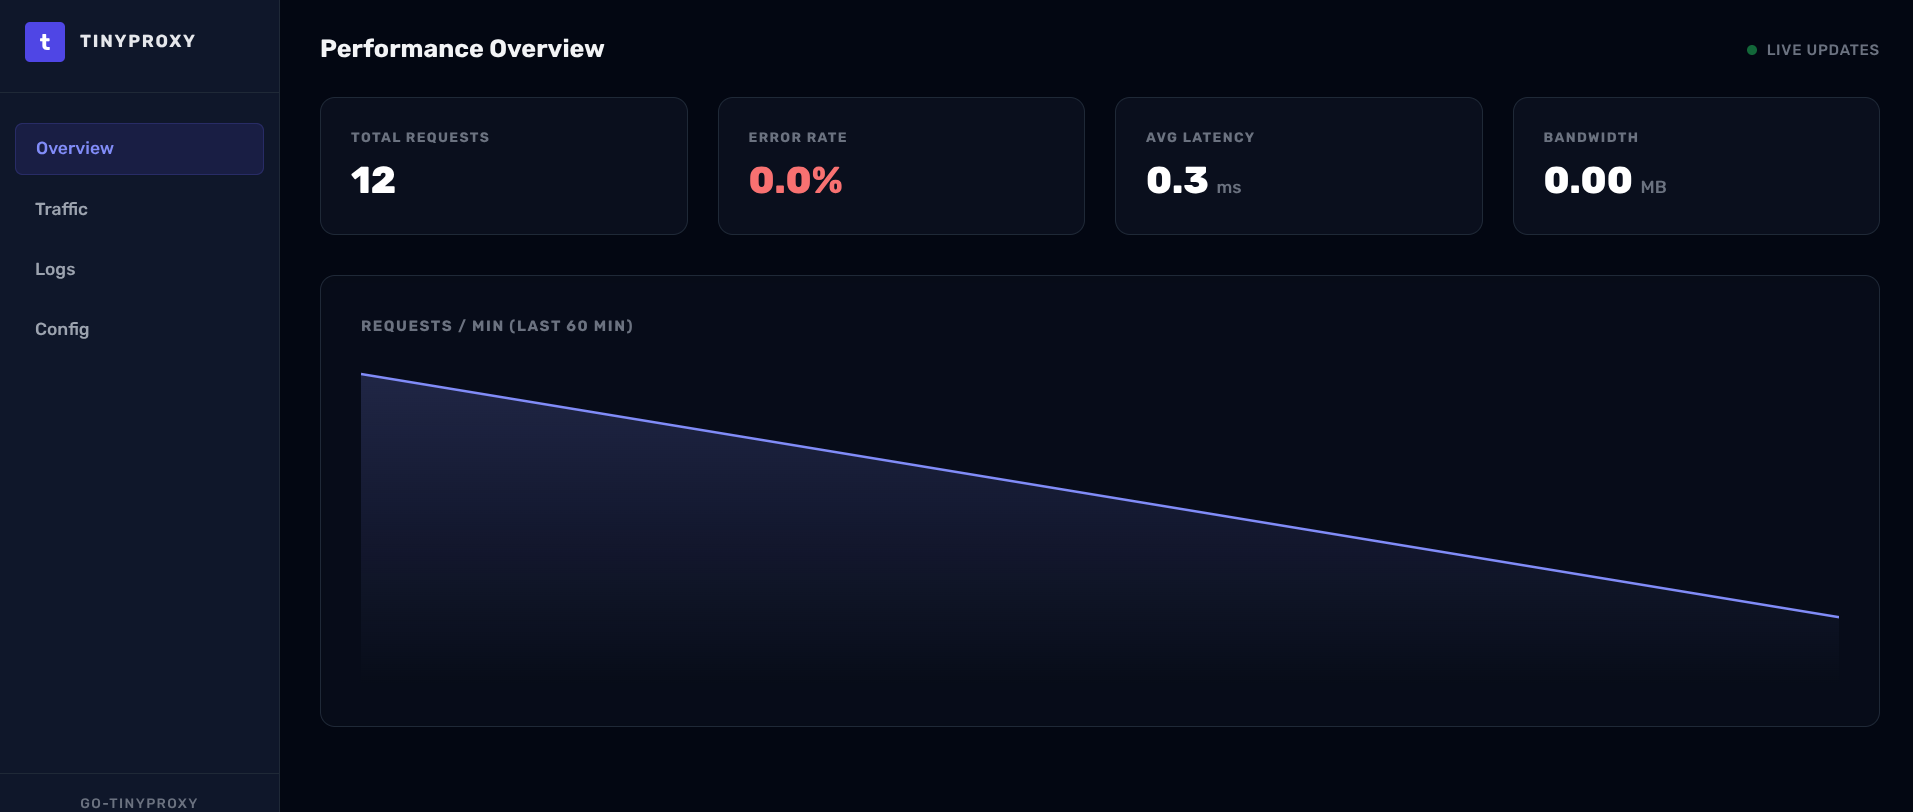
tinyproxy features a built-in administrative dashboard for real-time observability of your proxy server.
Features
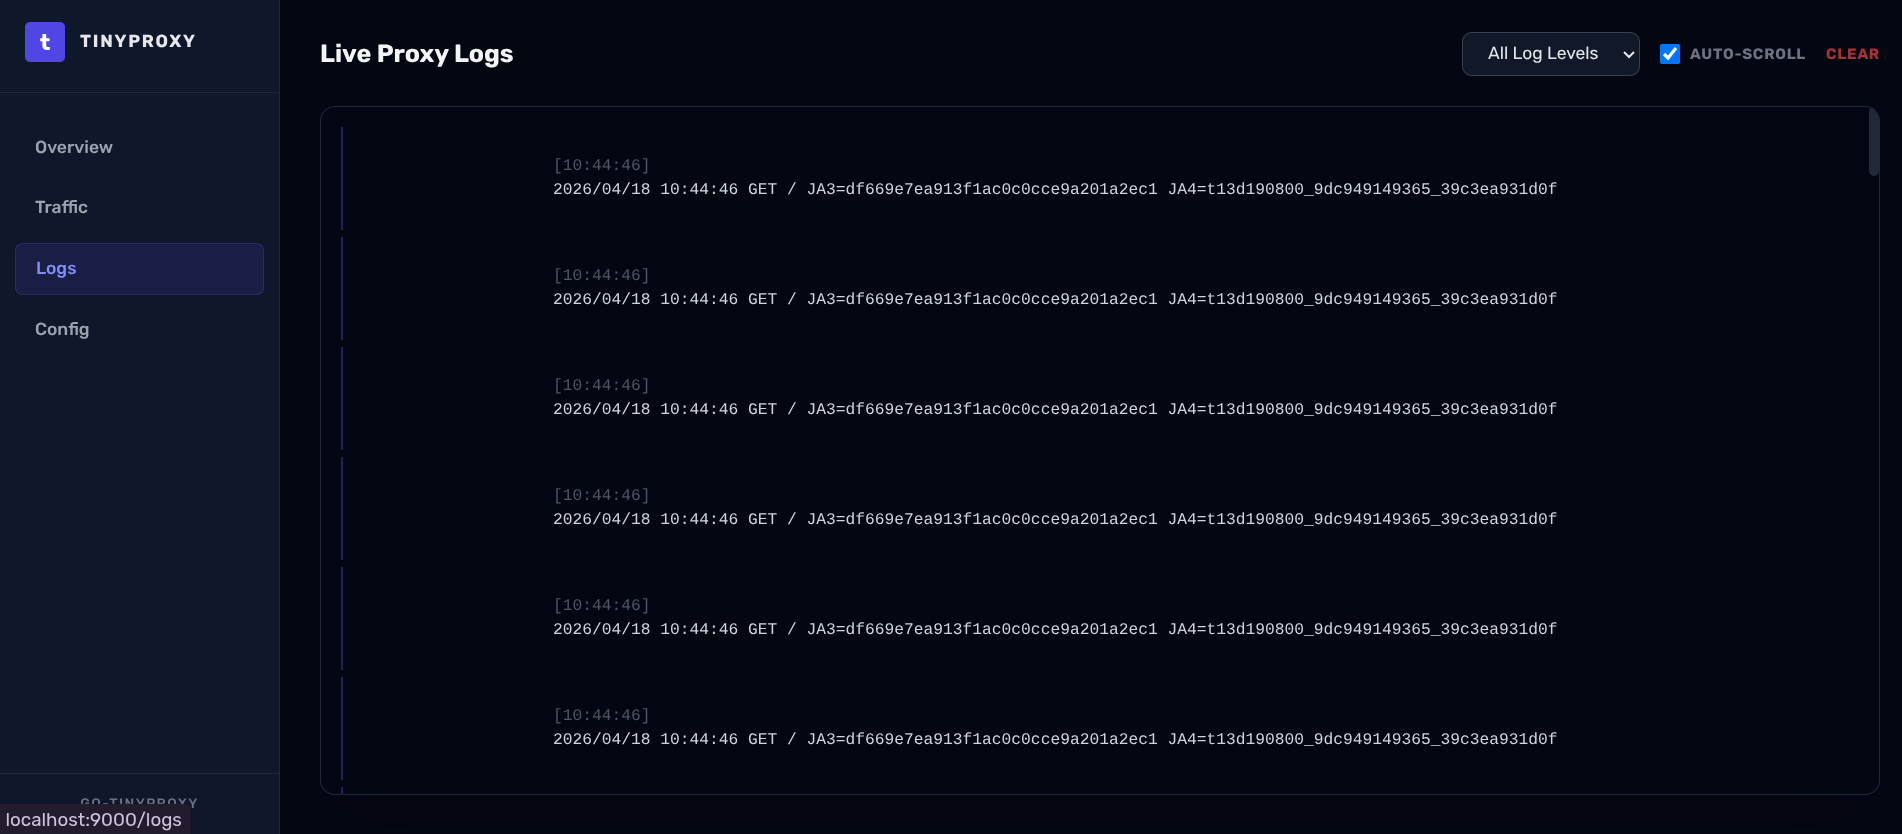
- Live Traffic Monitoring: View requests as they happen.
- Backend Health: Status of all configured upstreams.
- Security Logs: Visualizing blocked bots and honeypot hits.
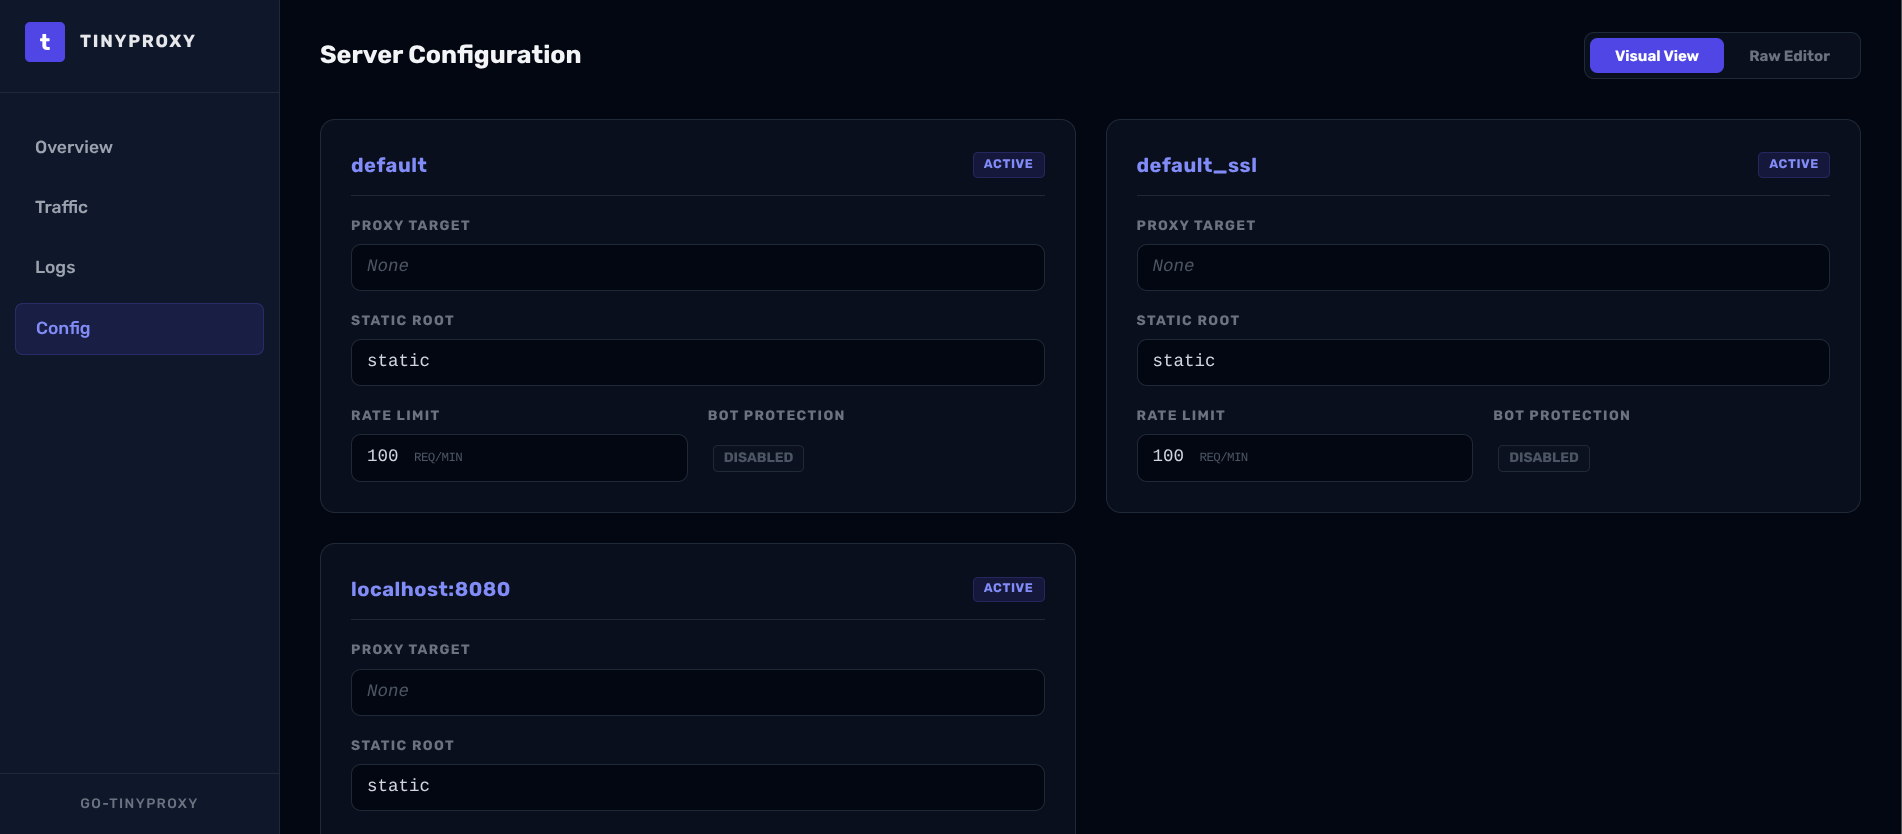
- Configuration Overview: Inspect current virtual host settings.
Accessing the Dashboard
The dashboard is enabled via CLI flags on the serve subcommand — it is not
configured in vhosts.conf.
1. Create a credentials file
Use dashboard passwd to generate a bcrypt-hashed credentials file:
go-tinyproxy dashboard passwd --output /etc/go-tinyproxy/dashboard.creds
2. Start the server with the dashboard enabled
go-tinyproxy serve \
  --enable-dashboard \
  --dashboard-host 127.0.0.1 \
  --dashboard-port 9000 \
  --dashboard-creds /etc/go-tinyproxy/dashboard.creds \
  --dashboard-db /var/lib/go-tinyproxy/dashboard.db
| Flag | Default | Description |
|---|---|---|
--enable-dashboard | false | Enable the admin dashboard |
--dashboard-host | 127.0.0.1 | Listen address (non-localhost requires --dashboard-creds) |
--dashboard-port | 9000 | Listen port |
--dashboard-creds | (none) | Path to username:bcrypt_hash credentials file |
--dashboard-db | dashboard.db | Path to the SQLite statistics database |
--dashboard-cert | (none) | TLS certificate for the dashboard (optional) |
--dashboard-key | (none) | TLS key for the dashboard (optional) |
Once running, visit http://127.0.0.1:9000 (or the configured host/port) and
log in with your credentials.
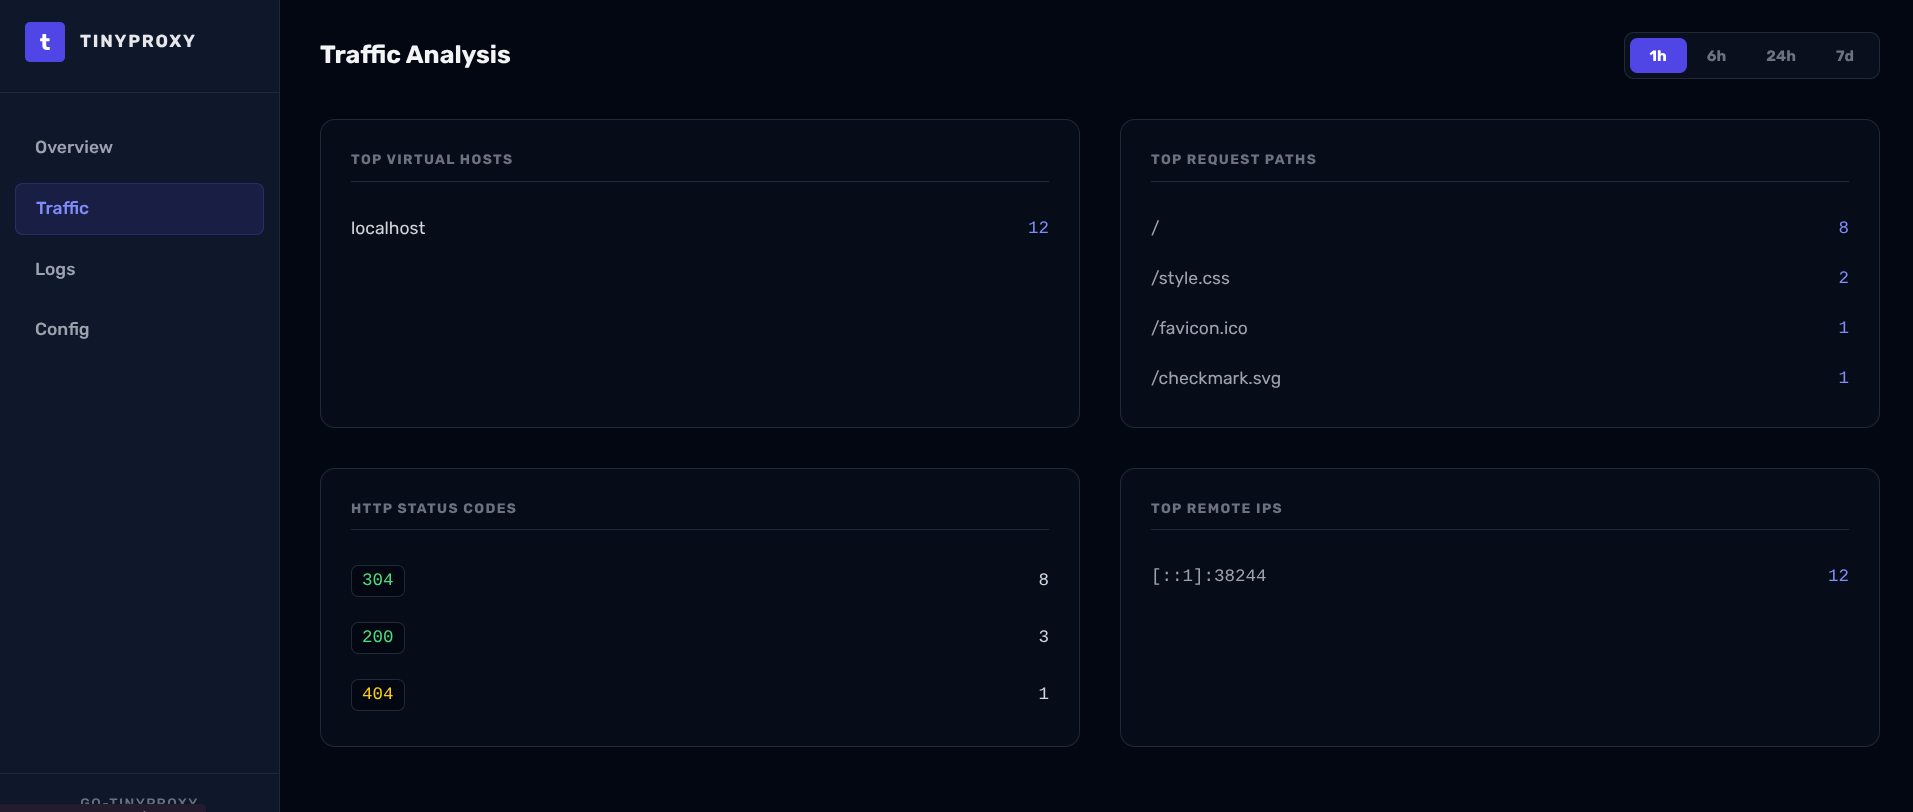
Screenshots